Data Visualization for White & Case
Created a family of infographics for White & Case internal presentations, transforming dense legal and financial data into clear visual narratives. Designed a cohesive system working within corporate brand guidelines (blue, black, gradients) while making each chart distinctive and engaging. Balanced sophistication appropriate for an enterprise legal context, with a bold visual approach improving data comprehension.
Project: White & Case Data Visualization
Role: Information Designer
Tools: Adobe Illustrator
Focus: Complex data visualization, corporate brand compliance, cohesive design systems
Project Overview
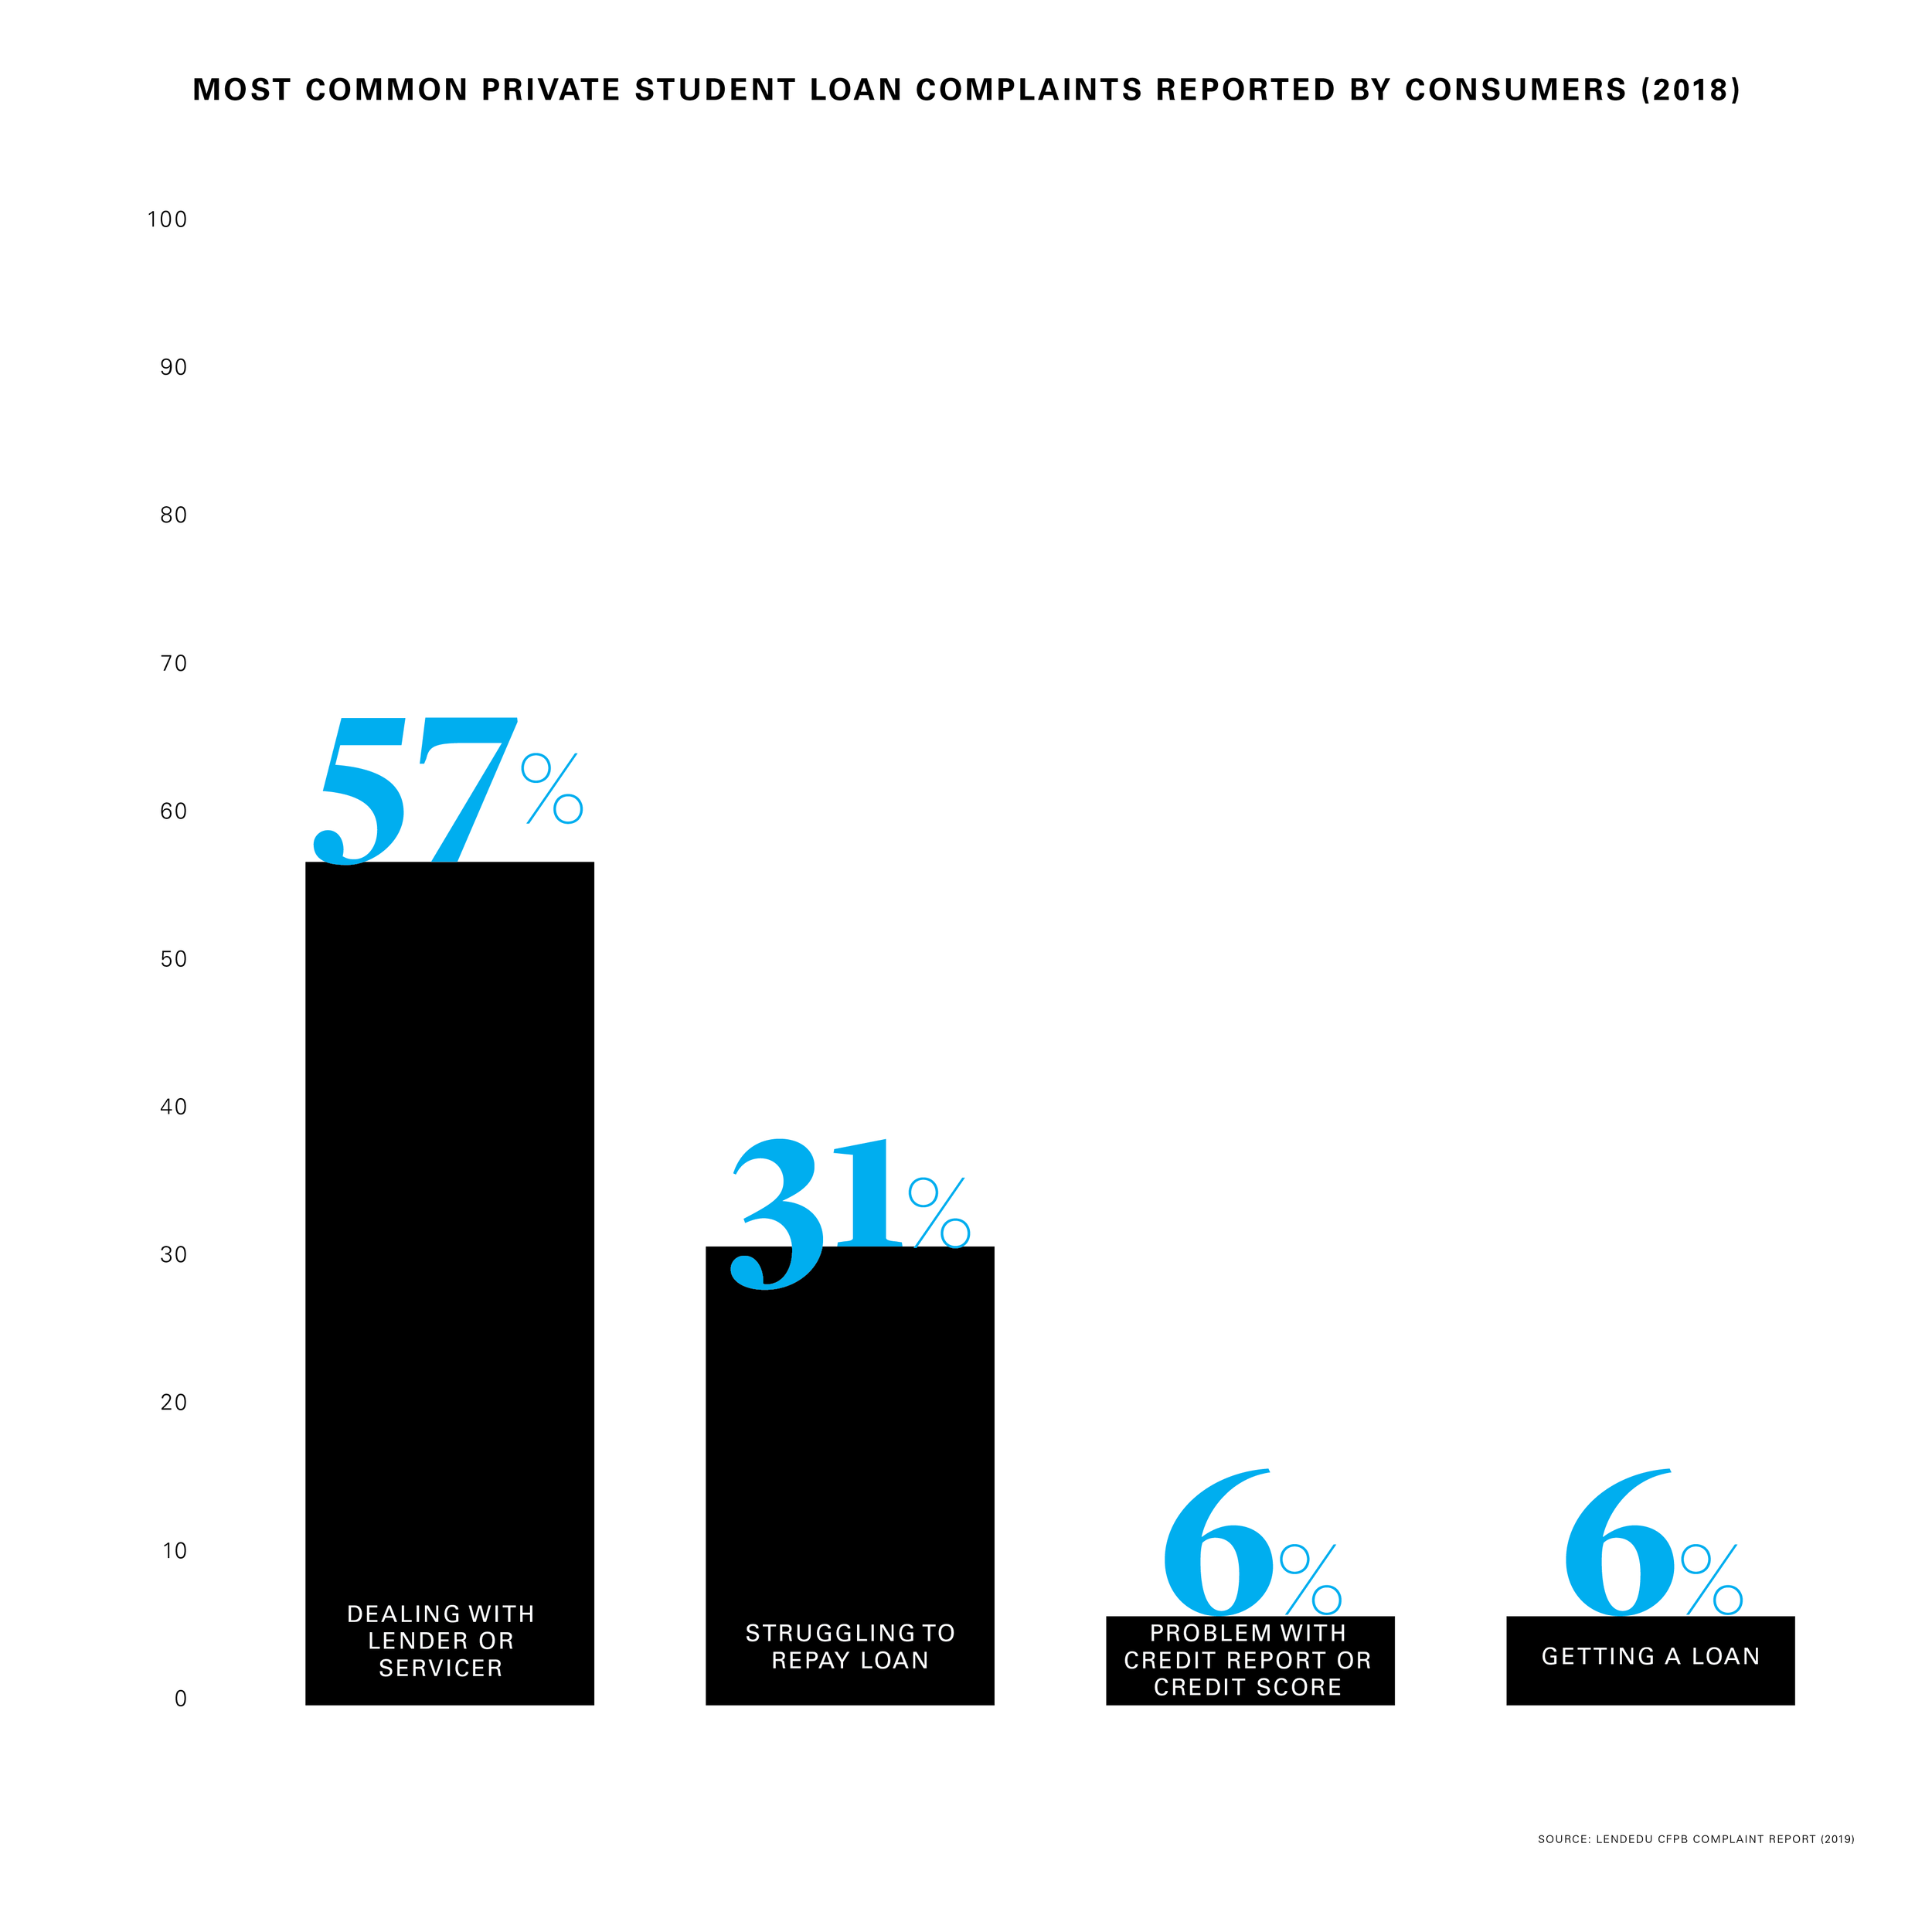
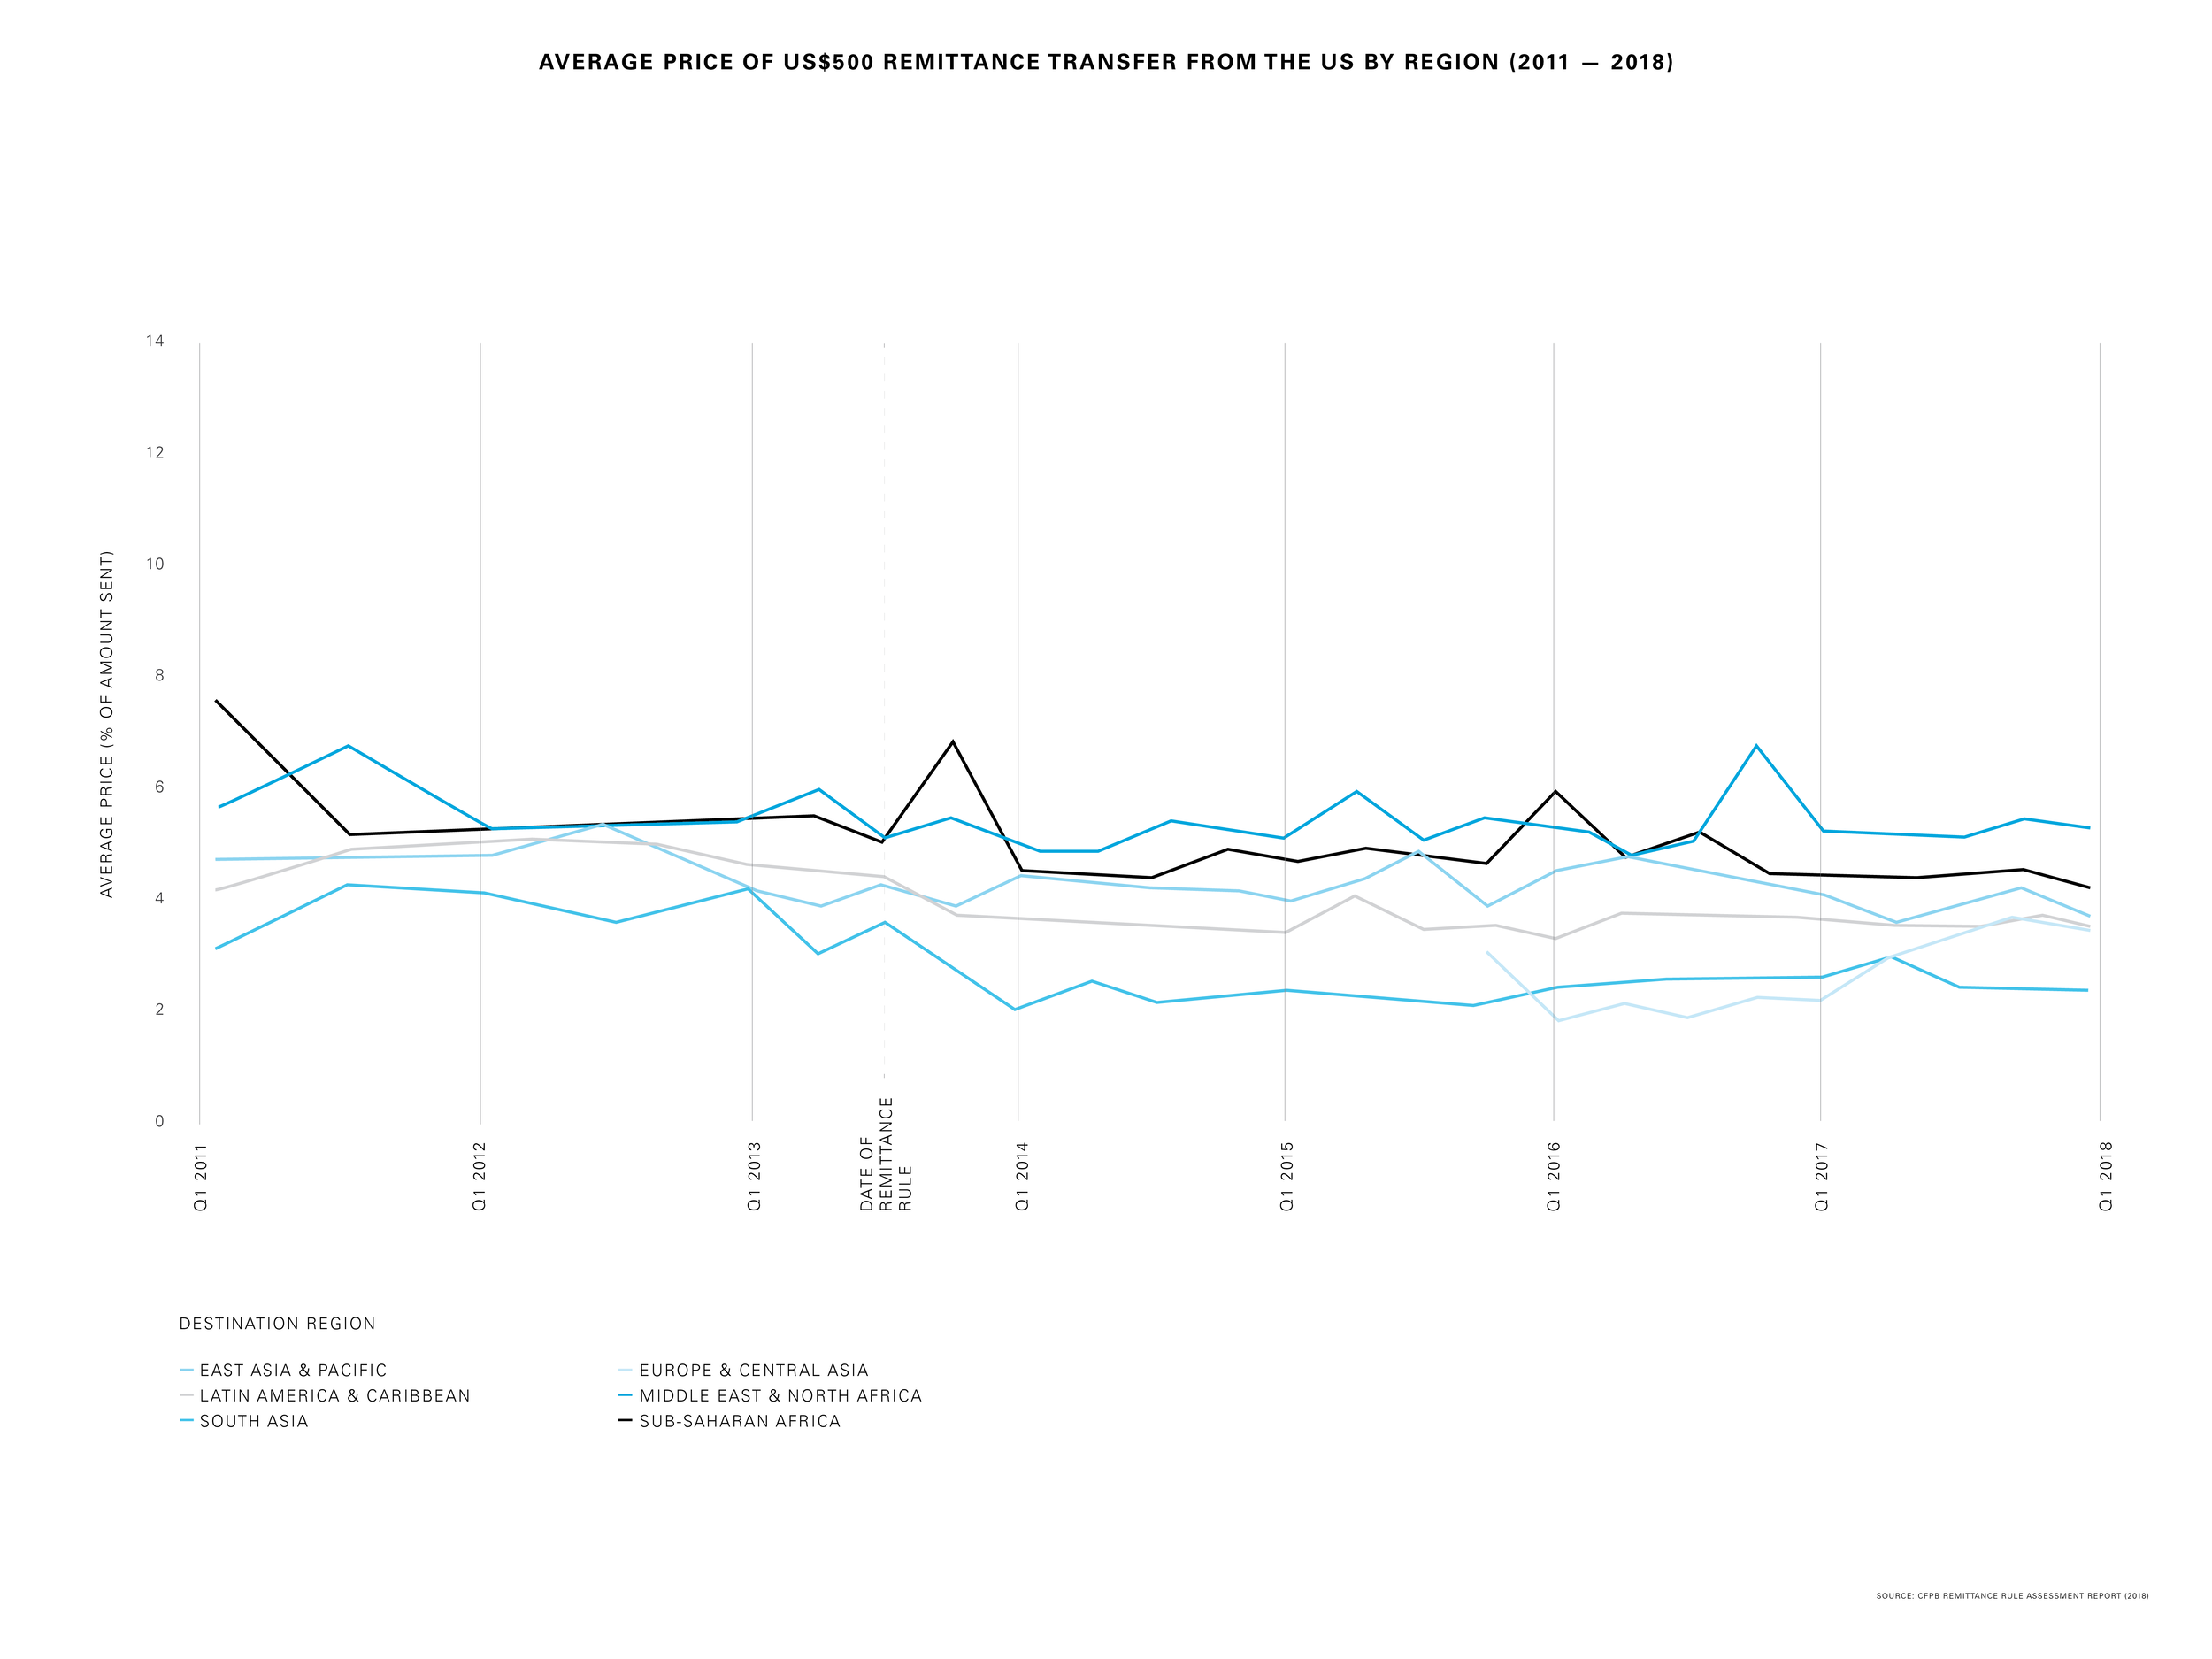
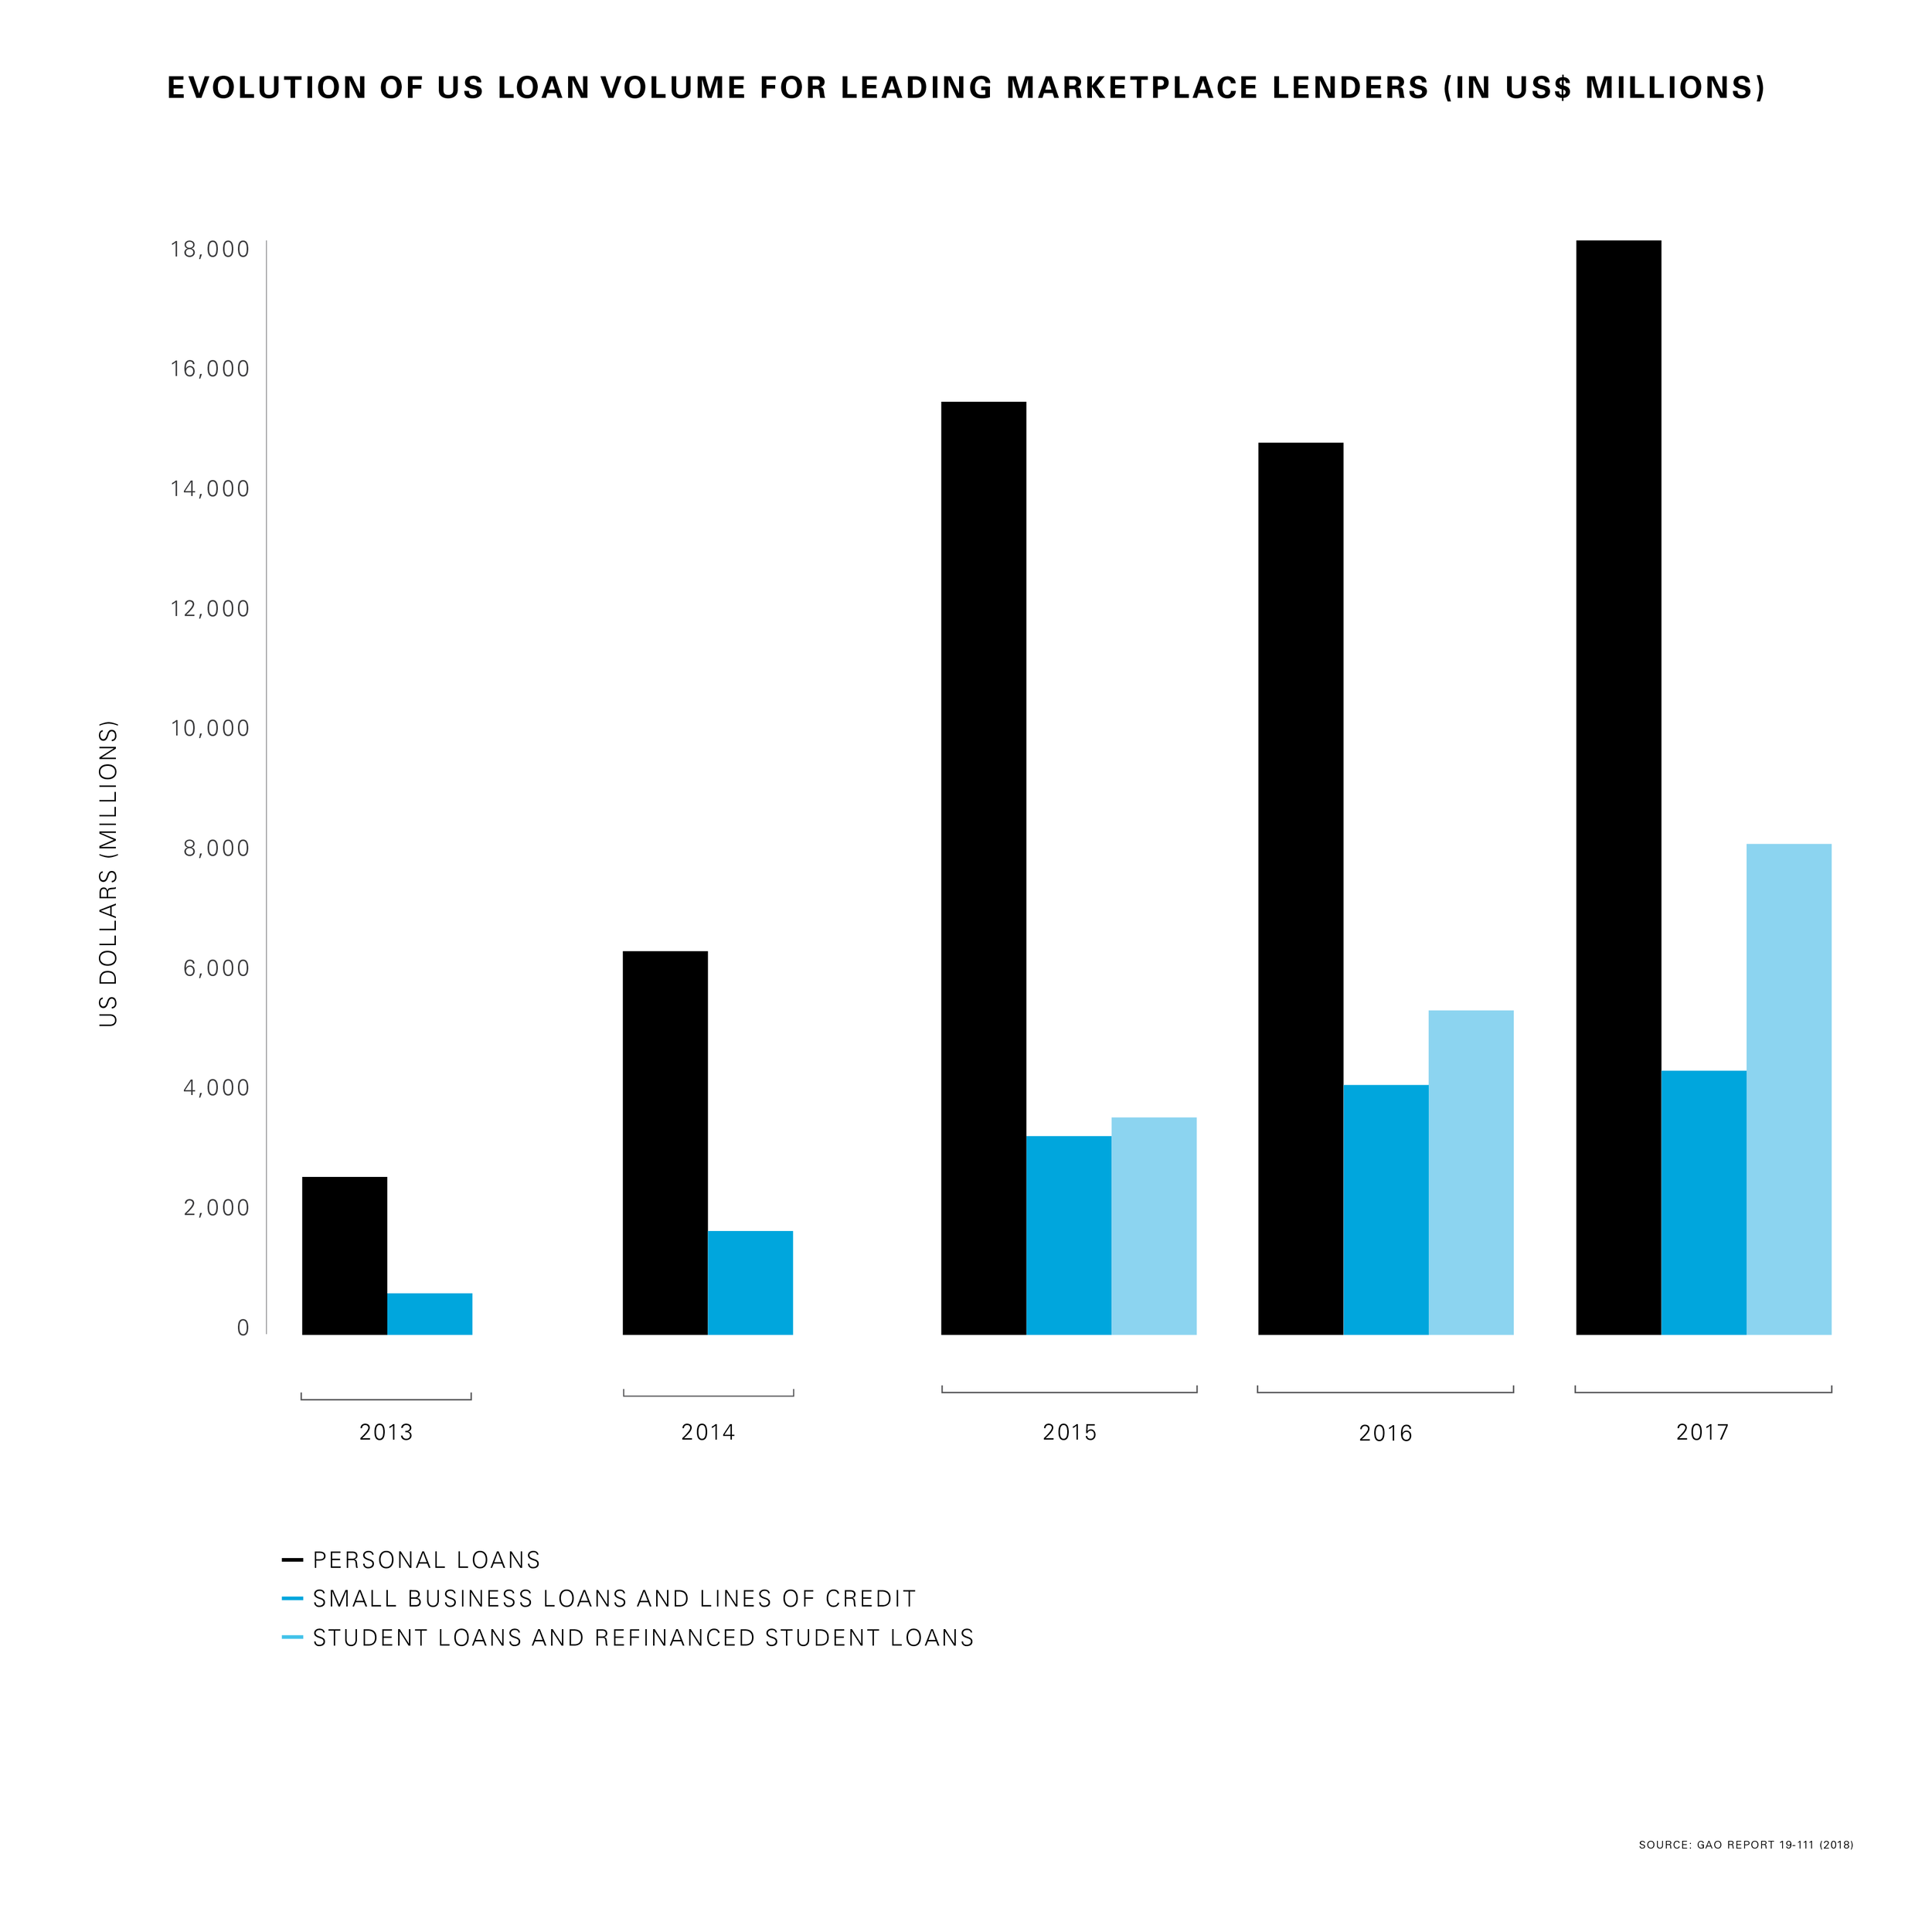
These infographics illustrate publicly available legal and financial data for internal White & Case presentations. The challenge was creating visual family—charts feeling connected without repetition—while maintaining corporate brand standards. Each infographic balances bold, engaging design with sophistication expected in enterprise legal environment.